Remote Sensing
Measure what can be measured, and make measurable what cannot be measured.”
— Galileo
- Atmospheric window
- a region of the EM spectrum that is not blocked by Earth’s atmosphere
- Photon
- a discrete electromagnetic radiation packet of energy
- Pixel
- a picture element; the quantized spatial resolution of a remotely sensed image
- Remote sensing
- the collection and interpretation about a target without being in physical contact with it (broad definition); more specifically, it is the non-contact recording of information from the electromagnetic spectrum by means of instruments on platforms (e.g., spacecraft) and the analysis of this information by means of visual and digital image processing
Remote sensing is a non-contact method of recording information through the collection (or emission-and-collection) of electromagnetic (EM) radiation via sensors aboard aircraft or spacecraft. More than just a collection system, remote sensing also consists of the art and science of making measurements. It is these measurements—images—that can be integrated into GIS. Once measurements have been made, those working in remote sensing are also specialized in the manipulation, analysis and visualization of the collected images.
Remote sensing is useful for measuring:
- X-Y geographic locations
- Z topographic information
- vegetation health (e.g., chlorophyll content, water content, percent biomass, phytoplankton)
- surface (e.g., sea surface) temperature
- surface roughness
- soil moisture and evaporation
- atmospheric chemistry, temperature, water content, wind speed, precipitation, cloud coverage
- snow and ice coverage
- volcanoes and volcanic activity
- earthquakes
- land use
- ocean health
- etc.
| Advantages | Disadvantages |
|
|
Electromagnetic (EM) spectrum
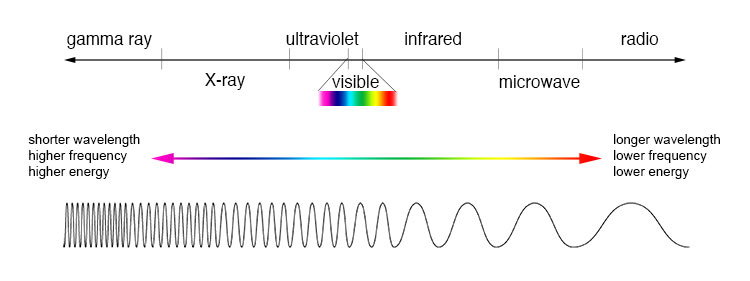
Figure. The EM Spectrum (NASA’s Imagine Universe)
Electromagnetic detection
Electromagnetic (EM) waves
- vary in wavelength, ν, frequency, λ, and energy, E, which are all mathematically interrelated
- range from gamma (short wavelength/high energy) to radio (long wavelength/low energy)
- travel in discrete packets of energy called photons
- Wavelengths
- gamma rays—(≤0.0001 microns)
- measure changes in the energy state of protons and neutrons
- X-rays—(≤0.01 microns)
- measure photon absorption by the inner shell of electrons
- ultra violet (UV)—(≤0.4 microns)
- measure photon emission/absorption by the outer shell of electrons;
- provide information regarding transition metals (e.g., Fe2+, Fe3+, Cu2+) and chlorophyll
- visible light (VIS)—(≤0.67 microns)
- blue (0.450–0.495 microns)
- green (0.495–0.570 microns)
- red (0.620–0.720 microns)
- near infrared (NIR)—(≤1.5 microns)
- similar to UV
- short-wave infrared (SWIR)—(≤3.0 microns)
- measure vibrational structure of certain minerals (e.g., OH–, CaCO3)
- thermal infrared (TIR)—(≤100 microns)
- provide information on molecules and their bond strength;
- excellent for mineralogy;
- also provide information on surface temperature (e.g., cloud-top radiation for precipitation estimation)
- microwaves—(0.1 cm–10 m)
- provide little to no information on composition, but a lot of information about particle size and surface roughness
- gamma rays—(≤0.0001 microns)

Figure. Electromagnetic wavelength (National Aeronautics and Space Administration 2010)
Not all wavelengths in the EM spectrum can reach the surface of the Earth. Water (H2O), carbon dioxide (CO2), and ozone (O3) are the main atmospheric gases that absorb photons in the visible (VIS) to near infrared (NIR) energy bands. Regions that are not blocked by the Earth’s atmospheric gases and/or dust particles are called atmospheric windows.
Even through atmospheric windows, EM energy interacts with gases and particulates before it interacts with the surface. There are five categories for energy interaction:
- reflection
- energy returns from the surface with a reflection angle equal and opposite to the incidence angle
- scattering
- deflection in multiple directions
- selective (Rayleigh) scattering
- caused by particles that are much smaller than the wavelength being scattered (e.g., effects of N2, O2, and O3 on shorter VIS wavelengths cause the sky to look blue)
- selective (Mie) scattering
- caused by particles that are about equal to the wavelength being scattered (e.g., effects of dust and smoke pollution on longer VIS wavelengths cause red skies)
- non-selective scattering
- caused by particles that are much larger than the wavelength being scattered (e.g., effects of water vapor and ice crystals on all VIS wavelengths cause clouds and fog to look white)
- transmission/refraction
- energy passes through a material
- may be refracted due to the difference in density between the two materials
- absorption
- energy is transformed (e.g., heating)
- emission
- energy is released
Remote sensing systems
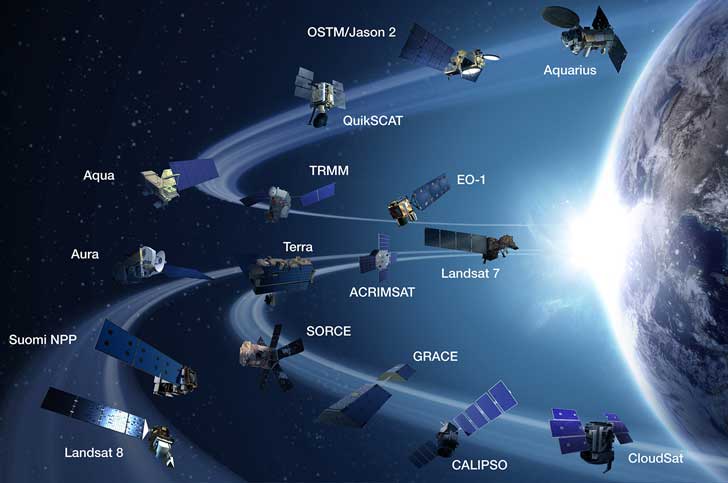
Figure. Satellite missions to advance our understanding of Earth (NASA). https://espd.gsfc.nasa.gov/images/esmo.jpg
There are two types of remote sensing systems.
- passive
detects energy from natural illumination or emission
Examples: camera, visible/near infrared instruments, thermal instruments
- active
provides the energy/illumination that is reflected back to a sensor for detection
Examples: camera with flash, flashlight and eye, radar, lasers
Sensing systems are typically onboard an orbiting satellite. The sensor “views” a portion of the Earth’s surface, called the swath.

Figure. Image swath from an orbiting satellite.
Image processing and analysis
Remote sensing measurements are collected as images (i.e., raster format). Images are a collection of pixels (picture elements). Pixels store recorded values, which are called digital numbers (DNs). For a typical gray-scale image, DNs are stored as 8-bit integers with values that range from 0–255.
Note: the human eye can only distinguish about 30 shades of gray.
To visualize the images, only a single 8-bit image can be used in each of the three primary colors (i.e., red, green and blue). The mixing of these primary colors produces all other colors.
The comparison of two or more spectral bands can help elucidate information about certain surface processes. For example, healthy vegetation exhibits a peak in the NIR spectral band, as well as a (albeit much smaller) peak in the VIS green.
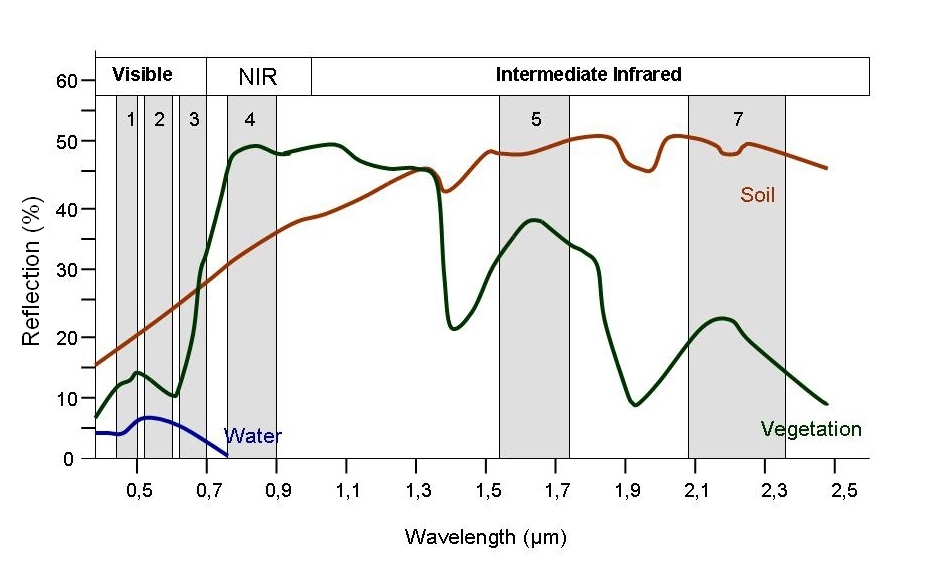
Figure. Spectral signatures of soil, vegetation and water. (Siegmund and Menz 2005. Online.)
References
National Aeronautics and Space Administration. 2010. “Introduction to the Electromagnetic Spectrum.” http://science.nasa.gov/ems/01_intro.
Siegmund, A., and G. Menz. 2005. “Fernes Nah Gebracht - Satelliten- Und Luftbildeinsatz Zur Analyse von Umweltveranderungen Im Geographieunterricht.” Geographie Und Schule 154: 2–10.